Graph 1 shows the number of beans found in a specific patch density.
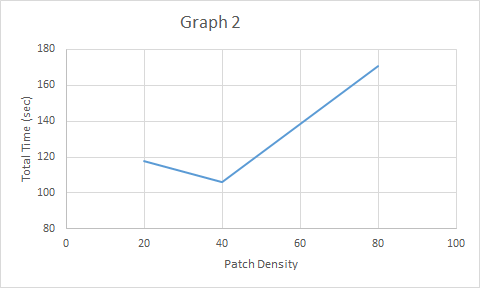
Graph 2 shows the total time spent in a specific patch.
Graph 3 shows the capture rate for a specific patch density. The capture rate was found by dividing the total beans found by the total amount of time spent in the patch.
Graph 4 shows the give up time for a specific patch density. The GUT was found by getting the time difference between the last bean captured and the patch departure time.
Graph 5 shows the cumulative energy gained per second.